
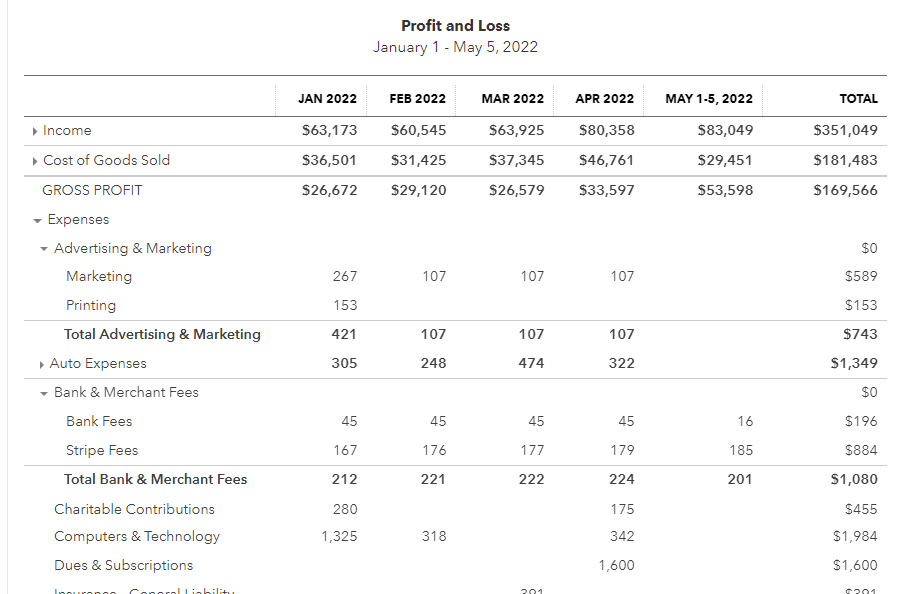
FEATURE REQUEST!!! In addition to the profit & loss for the last month, many of my clients like to see a report showing the year-to-date split by months. See below. This feature (and cash basis reporting) would definitely make me a dedicated Digits user.
Hey@shannonp ,
Sorry for the delay here! We’ve been digging into this request on our end, and although YTD reporting is on our roadmap, your idea spurred some questions on how you would want this too appear in Digits Reports:
In a YTD report, would you want those same comparisons to calculate based on the previous YTD interval? For example, if you were to generate a YTD report today (1/1/22 - 5/17/22), we’d compare the numbers from the previous year’s YTD interval (1/1/21 - 5/17/21).
Thank you in advance for your insights, and I’m happy to hop on a call anytime to discuss these details if that is easier!
Andrew
1. Yes, that would be a great feature!
2. I would say only the months of the current year since that’s the extent of the report I’m looking to run.
We also hear that the monthly columns are valuable when you print reports, since the Hover to Discover feature in Digits, which could act in lieu of columns, wouldn’t show up if you print.
I have a follow up question for later in the year when many months have passed (e.g. October, November): If possible, would you expect us to squeeze all of the month columns on the printed report even if it negatively affects the presentation? or would you prefer we fit the max amount of month columns so that the report presentation is clear, knowing that earlier months (e.g. January, February) would be cutoff?
FEATURE REQUEST!!! In addition to the profit & loss for the last month, many of my clients like to see a report showing the year-to-date split by months. See below. This feature (and cash basis reporting) would definitely make me a dedicated Digits user.
Yes, I second this! My clients are also asking for this and I think it would be a great addition to the report.
This feature would be wonderful. QBO’s Simple Start does not let you compare previous month’s so I have to create and update a spreadsheet.
Hey, I know I’m late to this discussion, but I think the overarching question (and mine as well) is will their be an opportunity for us to create customized reports.
My standard reporting package includes 5 monthly reports. Some clients have as many as 8 reports, all of which are saved “custom” reports in QBO. Until I can present the same tools they are used to seeing inside Digits, then Digits remains a cool representation, but it’s not a replacement. It’s not even close, to be frank. At least for my business.
Hey@michaelalliman ,
Great to be chatting again!
Can you explain a little more about what you mean by “customized reports”? Are you trying to customize the time period that you want to report on? or include multiple individual reports (e.g. 5 monthly PnLs) in one package?
PS Thanks so much for continuing to provide such valuable feedback. It is messages like yours above that expands the potential of our Reports product.
Hey@Andrew ,
Because of the niche I work in, we have 5 “standard” reports we provide to each of our clients each month:
Additional custom reports for some clients include:
We are heavy on analysis, and we build out a lot of custom dashboard reports from the data provided. We provide the “why” behind the “what” in their financial reports, and while Digits is amazing visually, bar charts only provide the “what”, not the “why”.
I’m probably expecting too much, but for Digits to “replace” what we’re currently providing our clients, I need a more linear layout with data over time, and the ability to run reports for whatever time period I need to examine.
Having said that, I LOVE seeing what Digits is doing as an accountant. My clients, however, simply get overwhelmed with all the popups and rabbit holes they find they can get lost in.. :)
I’m a little late to the party, but I finally got a chance to hop in and play with Digits, and I LOVE it so far!! I will say, though, the first thing I noticed in the report builder was that I couldn’t add a YTD P&L. Not a major issue for me at the moment, but I would love to see this added in the near future. Overall, I am very impressed so far and I can’t wait to see what the future holds!
Hey@daskocina I am so happy to hear that you are loving Digits so far! I am glad you posted on this thread to let us know this is something you are interested in! We are actively discussing internally how best to create these reports to support them officially in Digits :) Our product team is keeping a close eye on this thread and we are excited to keep building tools to solve your biggest pain points.
I agree with this. Right now I’m trying to pull at report for all of 2022 and I’d love to be able to show my clients a breakdown of the year by month, especially in the charts that are shown.